
A Fishers or Westfield buyer asking whether they are actually better off buying than renting will find the answer in the math. But that only holds if the math is honest.
A rent-versus-own analysis based on a conservative appreciation rate yields a realistic picture. One built around the rosier historical average produces a sales pitch. Most buyers never see the variable. They see the final answer, and that is the problem.
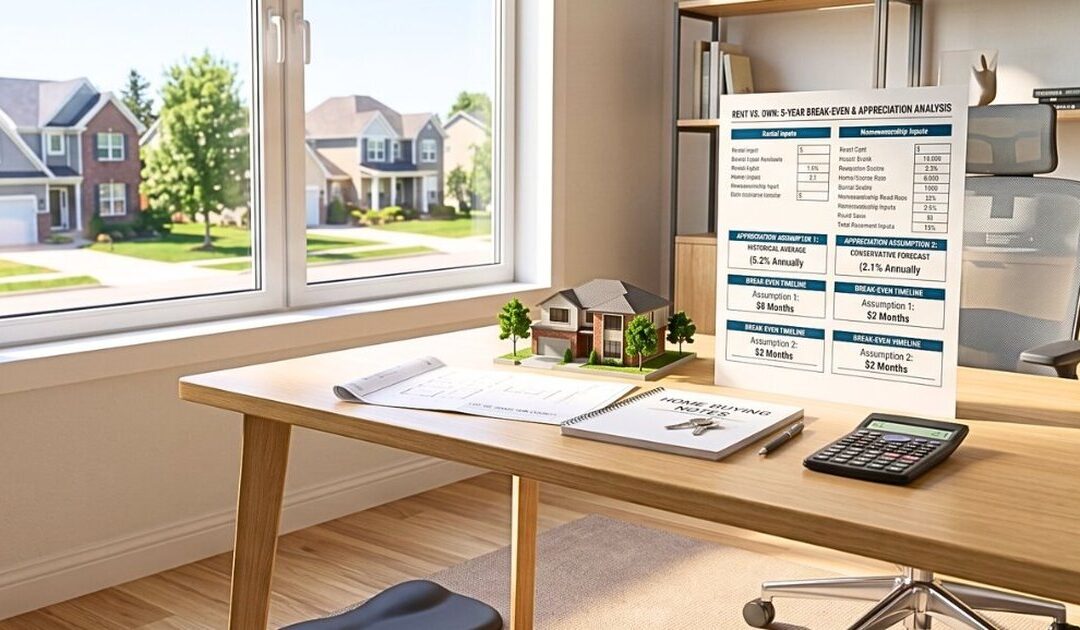
Rent-versus-own analyses are only as trustworthy as the appreciation rate behind them. Using the conservative forecasted rate rather than the higher historical average produces a realistic picture of homeownership in Hamilton County. Ownership still wins on the fundamentals, but the math should earn that conclusion honestly.
Two Numbers, One Meaningful Gap in Any Rent-Versus-Own Analysis
Two legitimate appreciation rates exist for building a rent-versus-own model. The 50-year historical average is around 3.68%, and the current forecast appreciation rate is closer to 2.8%. That is nearly a full percentage point of difference. Depending on the purchase price, it can meaningfully shift where the break-even year lands.
At a $300,000 price point, the gap is noticeable but not dramatic. Stretch the analysis to $600,000, $800,000, or $1 million, and the spread becomes a real variable that changes the picture entirely. The conservative forecasted rate is the right number to build around.
The reasoning is straightforward. A rent-versus-own analysis is a decision-support tool, not a sales document. Using the more favorable number to make ownership look more attractive is not education. It is salesmanship wearing the clothes of education.
The Real Long-Term Cost of Renting
Choosing the conservative appreciation number does not make ownership look bad. One of the most clarifying points in these conversations is about the nature of rent itself. Every dollar of rent you pay goes to someone else’s equity. Your effective interest rate on that transaction is 100%.
Even at a mortgage rate of 7%, you build equity, lock in a payment, and participate in appreciation, however modest the forecast may be. The gap between a 100% cost and a 7% cost is the real story in any rent-versus-own comparison. Appreciation is one piece of the analysis, and an important one. It should not be the deal-maker or deal-breaker when the fundamentals of ownership still hold.
A buyer in Fishers who stays in a home five to seven years is likely to come out ahead on the ownership side. That holds whether appreciation runs at 2.8% or 3.68%. The difference between those two numbers affects the margin, but it rarely flips the conclusion.
Showing Both Numbers Is the Honest Move
The principle behind using the conservative forecasted rate runs deeper than the methodology. It is about what the analysis is actually for.
“We show them both numbers, the historical and the forecasted, and then tell them why we’re using the smaller one. We’re not trying to move the numbers to make it more appealing than it really is. We want to create a realistic picture for the person.” – Tevis Durbin, Producing Branch Manager (NMLS #424899)
Comparing two models without knowing which appreciation rate was used to build them? That is the first question worth asking. A transparent advisor shows you both numbers and explains the difference. Have that conversation with The Durbin Team before you make a renting-versus-buying decision.
Why the Spread Is Larger Than Usual Right Now
That one-percent gap between historical and forecasted appreciation is not always present. In most market cycles, those two numbers run close enough that the choice between them barely registers. The current environment is different.
Forecasted appreciation has been dialed back as the market normalizes after several years of outsized price growth. Historical averages span decades of data, including post-recession surges and pandemic-era spikes. Using that number right now would be optimistic in a way that the current market does not support.
A buyer comparing a $400,000 purchase in Fishers to continued renting sees that a 1% difference translates into real dollars over five or ten years. It is enough to shift the break-even year and change what the right move looks like on paper. That is why the conservative number is the right foundation.
What to Ask Before You Trust Any Rent-Versus-Own Model
Buyers should ask where the appreciation rate came from when they get a rent-versus-own model. It is a simple question with a revealing answer.
A lender who selects the higher historical rate without explanation is optimizing for the outcome rather than accuracy. A lender who selects the lower forecasted rate and explains the reasoning is giving you a tool you can actually trust.
Ask specifically which appreciation rate they used and why. An answer that references only the historical average should prompt a follow-up about the current forecasted rate and how it changes the picture. A good advisor welcomes that question.
The goal is never to push toward a decision. It is to provide an honest picture so you can make the right choice for your situation. The way CFPB’s homeownership resources frame the total cost of owning can help you pressure-test any analysis you receive.
These numbers also mean something in real dollars. We have a post that takes a deeper look at the rent-versus-own decision and how buying builds wealth. It’s worth reading if you’re facing a similar decision.
Common Questions About Appreciation Rates and Rent-Versus-Own Analysis
What is a rent-versus-own analysis, and what makes one trustworthy?
A rent-versus-own analysis compares the total financial outcomes of renting versus purchasing a home over a defined time period. It factors in mortgage payments, equity accumulation, tax considerations, and projected appreciation. The quality of the analysis depends heavily on the assumptions used, and the single most important variable is the appreciation rate.
Which appreciation rate should be used in a rent-versus-buy model in Indiana?
In the current market, the conservative forecasted rate produces a more honest analysis than the long-term historical average. The 50-year historical average is around 3.68%, while the current forecast is closer to 2.8%. Using the higher number can make ownership look more favorable than current market conditions support. A trustworthy model uses the number that reflects today’s realistic outlook.
Does using a conservative appreciation rate mean buying is a bad decision?
No. Even with a conservative appreciation assumption, ownership typically outperforms renting over time. The effective interest rate on renting is 100%, since every dollar goes out without building any asset. A mortgage at 7% still generates equity accumulation and appreciation participation, even at the lower forecasted rate.
Does the appreciation gap matter more at higher price points?
Yes. At a $300,000 purchase price, the difference between 3.68% and 2.8% annual appreciation is noticeable but modest. At $600,000, $800,000, or $1 million, the compounded dollar difference becomes large enough to meaningfully shift the break-even year. That makes the choice of appreciation rate more consequential for move-up buyers in markets like Carmel or Westfield.
How has Hamilton County’s real estate market performed relative to forecasts?
Hamilton County has shown relatively consistent appreciation thanks to strong school systems and steady population growth. That stability means the conservative forecasted rate is realistic for the area rather than pessimistic. Buyers in this market can reasonably build plans around the lower number without assuming worst-case conditions.
How does inflation affect a rent-versus-own analysis over time?
Inflation affects owners and renters differently. Renters typically face annual rent increases that compound over time. Homeowners with a fixed-rate mortgage lock in their principal and interest payment for the life of the loan. Rising costs for taxes and insurance do affect owners, but the base payment stays fixed. This dynamic generally strengthens the ownership side of the analysis as the time horizon gets longer.
Can a rent-versus-own analysis be run for my specific situation?
Yes. A mortgage advisor can model the analysis using your actual target purchase price, estimated mortgage rate, current rent, and local appreciation forecasts. The result gives you a break-even timeline and a realistic comparison specific to your numbers. A short planning conversation is usually enough to get those figures on paper.
Make a Decision Built on Math You Can Trust
A rent-versus-own comparison built without the conservative appreciation rate may leave you working from an optimistic picture rather than an accurate one. The difference matters. Not because it changes whether ownership makes sense, but because it changes how clearly and confidently you can move forward.
Supreme Lending works with buyers across Hamilton County and beyond to conduct honest, detailed analyses grounded in realistic assumptions. Reach out to The Durbin Team to build a plan on math you can stand behind.
Tevis Durbin is the producing branch manager of Supreme Lending. He holds a Certified Mortgage Advisor (CMA) designation and an MBA in Finance, and serves on the State Board for the Mortgage Bankers of Indiana. With a 97.75% five-star customer rating built over 26 years, he leads The Durbin Team with a focus on transparent, education-first advising for buyers across Indiana and Michigan.
ABOUT THE AUTHOR
Tevis Durbin (NMLS #424899) is a Producing Branch Manager at Supreme Lending with over 26 years of experience in the mortgage industry. Leading “The Durbin Team,” Tevis combines his deep financial background – holding an MBA in Finance and a degree in Economics – with specialized loan programs to help Midwest homebuyers navigate complex markets. He is a Certified Mortgage Advisor, serves on the State Board for the Mortgage Bankers of Indiana, and acts as the Communication Chair for the Hamilton County division of MIBOR.